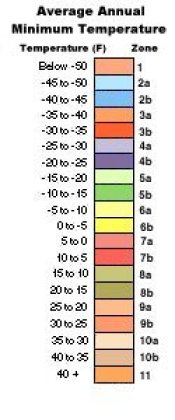
USDA Hardiness Zones and Average Annual Minimum Temperature Range
Zones 2-10 in the map have been subdivided into light and dark colored sections (a and b) that represent 5° F (2.8° C) differences within the 10° F (5.6° C) zone. The light color of each zone represents the colder section; the dark color, the warmer section.
Zone 11 represents any area where the average annual minimum temperature is above 40° F (4.4° C).
The map shows twenty latitude and longitude lines. Areas above an arbitrary elevation are traditionally considered unsuitable for plant cropping and do not bear appropriate zone designations. There are also island zones that, because of elevation differences, are warmer or cooler than the surrounding areas and are given a different zone designation.
Note that many large urban areas carry a warmer zone designation than the surroundingcountryside. The maps contain as much detail as possible, considering the vast amount of data on which it is based and its size.

| Zone | Fahrenheit | Celsius | Example Cities |
|---|---|---|---|
| 1 | Below -50 F | Below -45.6 C | Fairbanks, Alaska; Resolute, Northwest Territories (Canada) |
| 2a | -50 to -45 F | -42.8 to -45.5 C | Prudhoe Bay, Alaska; Flin Flon, Manitoba (Canada) |
| 2b | -45 to -40 F | -40.0 to -42.7 C | Unalakleet, Alaska; Pinecreek, Minnesota |
| 3a | -40 to -35 F | -37.3 to -39.9 C | International Falls, Minnesota; St. Michael, Alaska |
| 3b | -35 to -30 F | -34.5 to -37.2 C | Tomahawk, Wisconsin; Sidney, Montana |
| 4a | -30 to -25 F | -31.7 to -34.4 C | Minneapolis/St.Paul, Minnesota; Lewistown, Montana |
| 4b | -25 to -20 F | -28.9 to -31.6 C | Northwood, Iowa; Nebraska |
| 5a | -20 to -15 F | -26.2 to -28.8 C | Des Moines, Iowa; Illinois |
| 5b | -15 to -10 F | -23.4 to -26.1 C | Columbia, Missouri; Mansfield, Pennsylvania |
| 6a | -10 to -5 F | -20.6 to -23.3 C | St. Louis, Missouri; Lebanon, Pennsylvania |
| 6b | -5 to 0 F | -17.8 to -20.5 C | McMinnville, Tennessee; Branson, Missouri |
| 7a | 0 to 5 F | -15.0 to -17.7 C | Oklahoma City, Oklahoma; South Boston, Virginia |
| 7b | 5 to 10 F | -12.3 to -14.9 C | Little Rock, Arkansas; Griffin, Georgia |
| 8a | 10 to 15 F | -9.5 to -12.2 C | Tifton, Georgia; Dallas, Texas |
| 8b | 15 to 20 F | -6.7 to -9.4 C | Austin, Texas; Gainesville, Florida |
| 9a | 20 to 25 F | -3.9 to -6.6 C | Houston, Texas; St. Augustine, Florida |
| 9b | 25 to 30 F | -1.2 to -3.8 C | Brownsville, Texas; Fort Pierce, Florida |
| 10a | 30 to 35 F | 1.6 to-1.1 C | Naples, Florida; Victorville, California |
| 10b | 35 to 40 F | 4.4 to 1.7 C | Miami, Florida; Coral Gables, Florida |
| 11 | above 40 F | above 4.5 C | Honolulu, Hawaii; Mazatlan, Mexico |
Go Back to the USDA Hardiness Zone Map
Note: This publication is not copyrighted, and permission to reproduce all or any part of it is not required.